26 Jul 2026
Blackjack Simulations in University Classrooms Reveal How Students Grasp Probability Concepts Through Repeated Hands and Real-Time Outcome Tracking
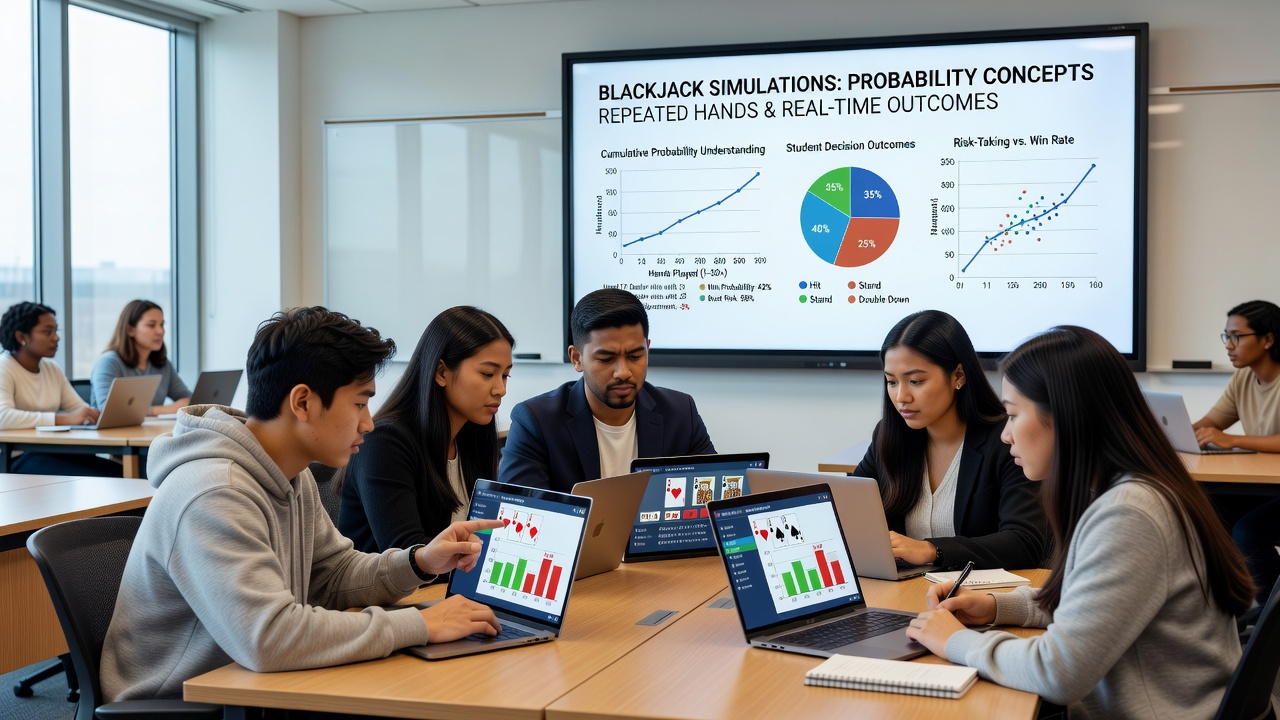
Universities have turned to blackjack simulations as a teaching tool that lets students engage directly with probability through repeated hands and immediate feedback on results, and this approach has gained traction in statistics and mathematics departments worldwide since the early 2020s. Instructors design these exercises so learners place virtual bets, observe card distributions, and log outcomes across dozens of rounds, which builds familiarity with concepts like expected value and conditional probability without relying on abstract formulas alone. Data from classroom trials show that students who complete 50 or more simulated hands demonstrate measurable improvement in calculating odds for specific scenarios compared to those who study only through lectures and textbooks.
Integration of Simulation Software in Probability Courses
Faculty members at various institutions incorporate specialized software platforms that replicate blackjack rules while recording every decision and payout in real time, and these systems generate reports that highlight patterns in student performance across different hand types. Programs often run on standard university computers or cloud-based interfaces, allowing classes of 20 to 30 students to work simultaneously while instructors monitor aggregate data on accuracy rates. Research indicates that such tools align with broader efforts to modernize STEM education, and a 2025 report from the National Science Foundation details increased adoption of interactive simulations in undergraduate mathematics curricula across the United States.
Students begin with basic strategy charts before progressing to independent play, during which the software tracks win rates, bust frequencies, and deviation from optimal decisions. This setup creates a feedback loop where learners adjust their approach based on visible statistics, and observers note that the process mirrors professional data analysis techniques used in fields like finance and risk management. In July 2026 several Canadian universities expanded these modules following pilot results that showed higher retention of probability terminology among participants.
Tracking Outcomes to Strengthen Conceptual Understanding
Real-time outcome tracking forms the core of these exercises because it provides instant visualization of probability distributions through graphs and tables generated after each session. Students review metrics such as the frequency of dealer wins versus player wins under varying deck penetrations, and this data helps clarify why certain decisions carry higher long-term costs. Software logs also capture time spent on each hand, revealing pacing differences that correlate with accuracy levels in follow-up assessments.
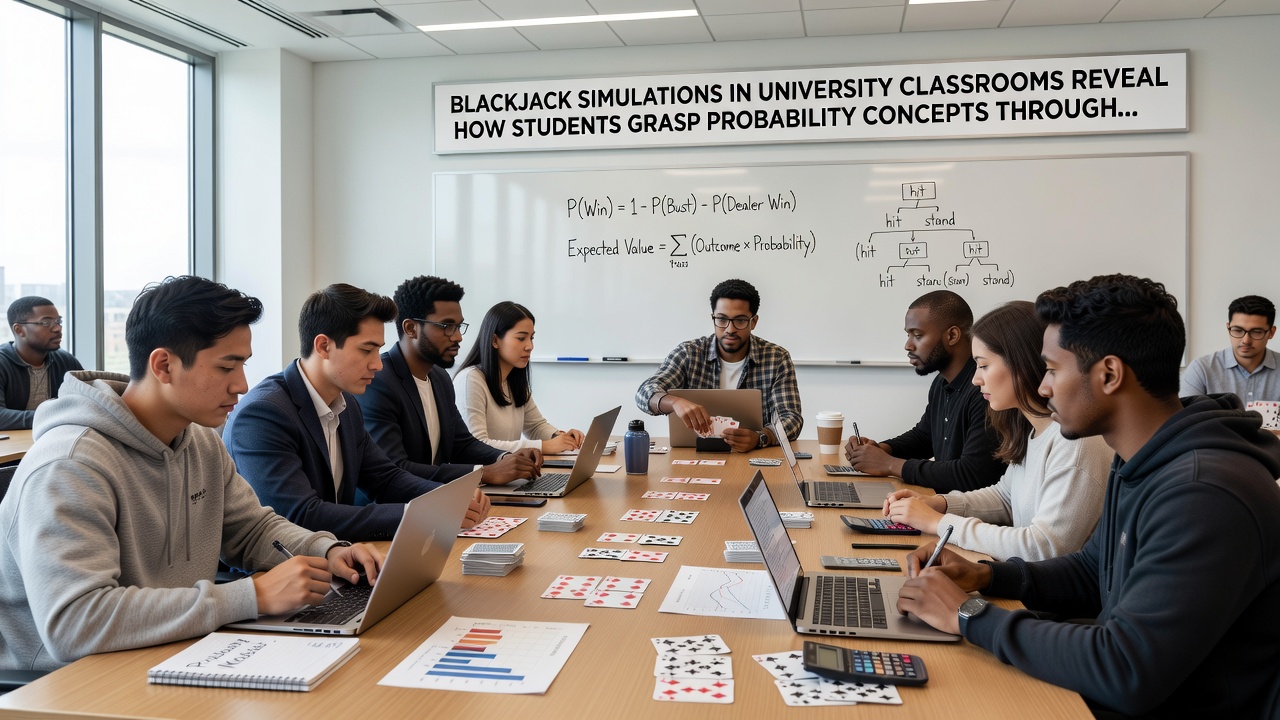
One study conducted at an Australian institution tracked 150 undergraduates across a semester and found that groups using simulations improved their scores on conditional probability tests by an average of 18 percent compared to control sections. The tracking feature allows instructors to identify common misconceptions early, such as overestimating the impact of recent hands on future results, and then address those through targeted review sessions. According to figures from Statistics Canada education surveys, similar simulation-based methods have appeared in more than 40 percent of introductory statistics courses at participating postsecondary schools by mid-2026.
Student Performance Data and Classroom Examples
Performance records from multiple semesters reveal consistent patterns where repeated exposure reduces errors in expected-value calculations, and case examples include a Midwest university program where students logged over 10,000 total hands in a single term. Instructors compile these records into class-wide summaries that illustrate how house-edge mechanics influence results over large sample sizes, helping learners connect theoretical distributions to practical outcomes. Researchers have observed that participants often start with intuitive guesses about favorable situations before the data forces revisions to those assumptions.
European universities have reported parallel findings in reports issued by the European Association for Research on Learning and Instruction, noting that simulation participants show stronger grasp of variance concepts when tested six weeks after the module ends. Classes sometimes incorporate team-based competitions where groups compare their cumulative results against simulated benchmarks, adding a collaborative element that reinforces collective analysis of the numbers. This method keeps the focus on measurable learning gains rather than isolated test scores.
Conclusion
Blackjack simulations continue to supply universities with a structured environment for exploring probability through hands-on repetition and detailed outcome records, and ongoing implementations in 2026 reflect sustained interest in these methods across multiple regions. The combination of repeated practice with immediate data feedback supports clearer connections between abstract principles and observable results, while performance metrics help educators refine their approaches. As more departments adopt these tools, the accumulated classroom data offers further opportunities to examine how simulation-based learning influences long-term retention of core statistical ideas.